
Investor documents
November 2026 factsheets and investor decks, with data to 31 October 2026.
Documents
Emerging Opportunities PMS
In rupees

GIFT City fund
In US dollars

Returns and allocation.
As of 31 October 2026
Returns vs benchmarks
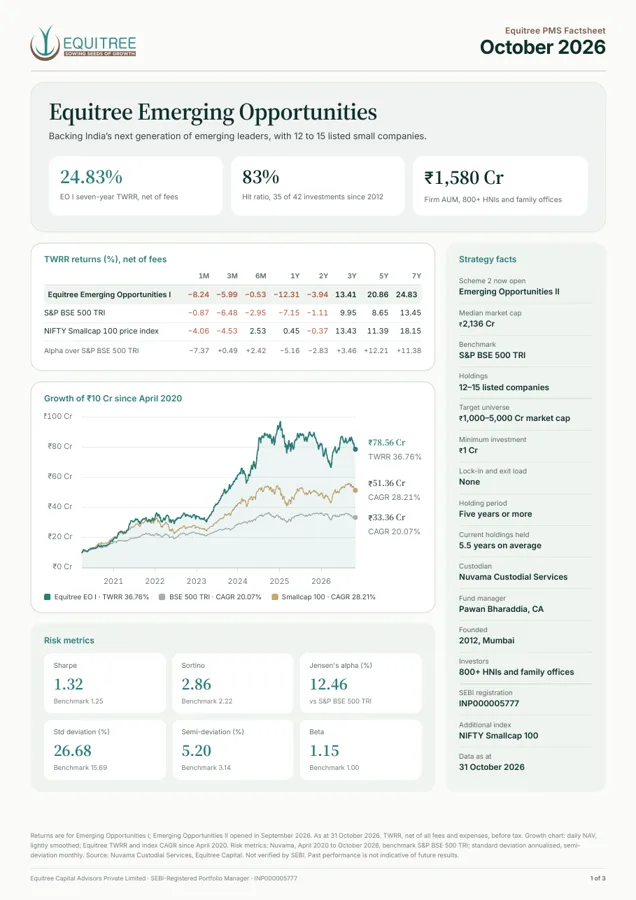
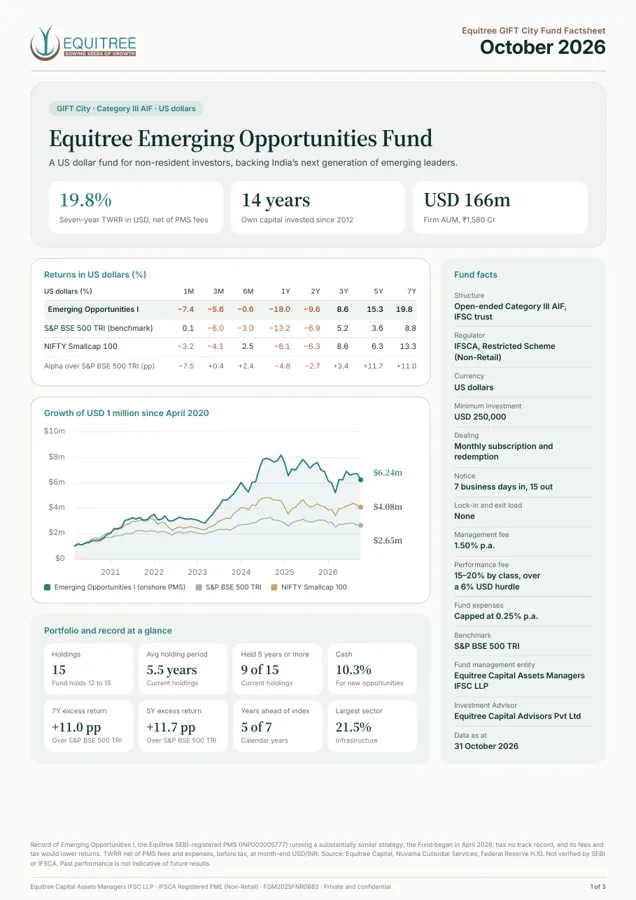
TWRR, net of fees
| Metric | 1M | 3M | 6M | 1Y | 2Y | 3Y | 5Y | 7Y |
|---|---|---|---|---|---|---|---|---|
| Emerging Opportunities I | -8.24% | -5.99% | -0.53% | -12.31% | -3.94% | 13.41% | 20.86% | 24.83% |
| BSE 500 TRI | -0.87% | -6.48% | -2.95% | -7.15% | -1.11% | 9.95% | 8.65% | 13.45% |
| Nifty Smallcap 100 | -4.06% | -4.53% | 2.53% | 0.45% | -0.37% | 13.43% | 11.39% | 18.15% |
| Outperformance vs BSE 500 TRI | -7.37% | +0.49% | +2.42% | -5.16% | -2.83% | +3.46% | +12.21% | +11.38% |
TWRR, net of fees and expenses, as of 31 October 2026. Returns over one year are annualised. Not verified by SEBI. Past performance does not indicate future returns. Figures are for Emerging Opportunities I; Emerging Opportunities II has no performance history yet.
Sector allocation
| Infrastructure | 21.53% |
|---|---|
| Chemicals and materials | 14.02% |
| Engineering products | 12.75% |
| Auto ancillaries | 9.91% |
| Apparel | 8.32% |
| Consumer durables | 8.17% |
| Agriculture | 6.30% |
| Oil & gas | 5.90% |
| Others | 2.84% |
| Cash and cash equivalents | 10.26% |
Cash includes liquid mutual fund equivalents.
© 2026 Equitree Capital Advisors Private Limited